Archive
Ora-04031 – Unable to allocate 16440 bytes of shared memory
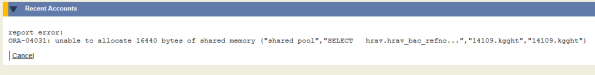
We were getting an issue with our live database after some recent downtime whereby the users were seeing memory issues when trying to load the application:
Upon reviewing the alert log I could see the following errors:
Thu Mar 21 13:24:02 2019
Errors in file /tpp/oracle/diag/rdbms/rblive/RBLIVE/trace/RBLIVE_ora_5636552.trc
(incident=25358680):
ORA-04031: unable to allocate 14272 bytes of shared memory (“shared pool”,”WORK_EVENTS_”,”PLMCD^fbf4850c”,”BAMIMA: Bam Buffer”)
Use ADRCI or Support Workbench to package the incident.
See Note 411.1 at My Oracle Support for error and packaging details.
Errors in file /tpp/oracle/diag/rdbms/rblive/RBLIVE/trace/RBLIVE_ora_47252140.trc (incident=25359355):
ORA-04031: unable to allocate 16440 bytes of shared memory (“shared pool”,”WORK_EVENTS_API
Use ADRCI or Support Workbench to package the incident.
See Note 411.1 at My Oracle Support for error and packaging details.
DDE: Problem Key ‘ORA 4031’ was completely flood controlled (0x6)
Further messages for this problem key will be suppressed for up to 10 minutes
We had recently increased the memory allocations on this database, and although I did not think it could be a caching issue I executed the following to temporarily resolve the issue and allow users to continue with their work:
alter system flush shared_pool;
alter system flush buffer_cache;
Further investigation is required to resolve this issue
Further Investigation:
It is likely that the above error is caused by poor code.
First we would look through the shared pool for potential duplicate SQL statements – we search for the first 40 characters of the SQL statement and use that to identify statements that are similar
with potential_duplicates as(select
SUM(executions) as “Executions”,
SUM(elapsed_time/1000000) as “Elapsed Time”,
SUM(cpu_time/1000000) as “CPU Time”,
COUNT(*) as “Statements”,
SUBSTR(sql_text,1,40) as “SQL”
from v$sqlarea
group by
SUBSTR(sql_text,1,40)
having COUNT(*) > 5
order by count(*) DESC)
select *
from potential_duplicates
where rownum < 11;Executions Elapsed Time CPU Time Statements SQL
———- ———— ———- ———- —————————————-
314289 538.434676 275.59749 640 begin wwv_flow.g_computation_result_vc :
7066 1.674196 .817793 68 begin wwv_flow.g_boolean := :request = ‘
66 .179716 .086868 66 SELECT msg_no, type, text FROM messages
202 12.023259 5.778725 58 select h_utils.drilldown_link
159 10.510691 5.017982 58 SELECT h_utils.drilldown_link ( ‘
151 1.727624 .691142 57 SELECT aac_aat_description “Act
163929 96424.8735 40388.1749 49 declare rc__ number; simple_list__ owa
30390 3.183714 1.560978 37 begin — Required to reset variable as t
1133 .870898 .452353 36 begin wwv_flow.g_boolean := :request in
22128 14.951797 7.166428 36 declare function x return varchar2 is be10 rows selected.
There are 66 statements using “SELECT msg_no…” and each of these has only been executed once making them a prime suspect for SQLs that are identical and are parsed with uniquely with literal values instead of bind variables. We can use the first 40 characters from the first statement to look through the shared pool for SQLs that match:
SQL> select sharable_mem,
sql_text
from v$sqlarea
where sql_text like ‘SELECT msg_no, type, text FROM messages%’;SHARABLE_MEM SQL_TEXT
———— ————————————————————————————————————
19398 SELECT msg_no, type, text FROM messages WHERE session_marker = 9182298 ORDER BY msg_no ASC
19398 SELECT msg_no, type, text FROM messages WHERE session_marker = 9182308 ORDER BY msg_no ASC
19406 SELECT msg_no, type, text FROM messages WHERE session_marker = 9182328 ORDER BY msg_no ASC
19406 SELECT msg_no, type, text FROM messages WHERE session_marker = 9182288 ORDER BY msg_no ASC
19398 SELECT msg_no, type, text FROM messages WHERE session_marker = 9182303 ORDER BY msg_no ASC
19406 SELECT msg_no, type, text FROM messages WHERE session_marker = 9182324 ORDER BY msg_no ASC
19382 SELECT msg_no, type, text FROM messages WHERE session_marker = 9182329 ORDER BY msg_no ASC
19406 SELECT msg_no, type, text FROM messages WHERE session_marker = 9182292 ORDER BY msg_no ASC
19406 SELECT msg_no, type, text FROM messages WHERE session_marker = 9182326 ORDER BY msg_no ASC
19382 SELECT msg_no, type, text FROM messages WHERE session_marker = 9182293 ORDER BY msg_no ASC
19406 SELECT msg_no, type, text FROM messages WHERE session_marker = 9182318 ORDER BY msg_no ASC
19406 SELECT msg_no, type, text FROM messages WHERE session_marker = 9182330 ORDER BY msg_no ASC
19406 SELECT msg_no, type, text FROM messages WHERE session_marker = 9182322 ORDER BY msg_no ASC
19398 SELECT msg_no, type, text FROM messages WHERE session_marker = 9182304 ORDER BY msg_no ASC
19382 SELECT msg_no, type, text FROM messages WHERE session_marker = 9182323 ORDER BY msg_no ASC
19406 SELECT msg_no, type, text FROM messages WHERE session_marker = 9182333 ORDER BY msg_no ASC16 rows selected.
Here we can see that the application is not using bind variables for filtering and is generating a unique SQL with a literal predicate for each query. To resolve the application
ORA-01089: immediate shutdown in progress – no operations are permitted
Upon investigating why one of our filesystems was maxing out on space it became apparent one of our databases on the server was generating a lot of trace files. When I reviewed the alert log I found the following:
ORA-01089: immediate shutdown or close in progress – no operations are permitted
We found that this error was being generated since a cold backup attempt was made a few days prior. Business users have been able to use the database so we hadn’t had any complaints and our OEM isn’t setup to email us about alert log errors, so we were none the wiser.
During the cold backup a few days prior we had received the below error message and the backup had failed:
RMAN-06900: WARNING: unable to generate V$RMAN_STATUS or V$RMAN_OUTPUT row RMAN-06901: WARNING: disabling update of the V$RMAN_STATUS and V$RMAN_OUTPUT rows ORACLE error from target database: ORA-09817: Write to audit file failed. IBM AIX RISC System/6000 Error: 28: No space left on device Additional information: 12
When looking in the alert log to when the issue started we can see the following:
Wed Mar 27 22:08:30 2019
Job queue slave processes stopped
Stopping Emon pool
Wed Mar 27 22:08:31 2019
Stopping all emon processes
Stopping EMNC
Wed Mar 27 22:08:35 2019
Stopping all emon processes
Wed Mar 27 22:13:34 2019
Active call for process 49217636 user ‘oracle’ program ‘oracle@s-cssorbdb-test.b
cc.lan (TNS V1-V3)’
SHUTDOWN: waiting for active calls to complete.
Wed Mar 27 22:47:29 2019
Errors in file /tpp/oracle/diag/rdbms/rbtest/RBTEST/trace/RBTEST_ora_49217636.tr
c:
ORA-01089: immediate shutdown or close in progress – no operations are permitted
ORA-01089: immediate shutdown or close in progress – no operations are permitted
ORA-01089: immediate shutdown or close in progress – no operations are permitted
ORA-01089: immediate shutdown or close in progress – no operations are permitted
ORA-01089: immediate shutdown or close in progress – no operations are permitted
This has occurred because the shutdown process was still in progress, in order to get the database back to a steady state we need to issue a shutdown abort. To prevent any data loss, we run an RMAN level 1 incremental backup and tell the business users to stop all activity on the database.
Once the backup has run successfully issue the following:
SQL> shutdown abort
SQL> startup
SQL> shutdown immediate
SQL> startup
The second shutdown allows us to startup cleanly.
Check the alert log to ensure there are no further issues presented when the database comes back up
ORA-38754: FLASHBACK DATABASE not started; required redo log is not available
When trying to flashback the database to a previous restore point I was getting ORA-38754 stating that the required redo logs were not available. When I checked the oldest available flashback point I could see that I could flashback further than the restore point.
To resolve I needed to connect to the target and the catalog using RMAN, then use the archivelogs to restore the database to the previous restore point.
SQL> flashback database to restore point WEDNESDAY13032019;
flashback database to restore point WEDNESDAY13032019
*
ERROR at line 1:
ORA-38754: FLASHBACK DATABASE not started; required redo log is not available
ORA-38762: redo logs needed for SCN 9781584791168 to SCN 9781584794513
ORA-38761: redo log sequence 3 in thread 1, incarnation 2 could not be accessedSQL> SELECT to_char(oldest_flashback_time, ‘YYYY-MM-DD HH24:MI:SS’) FROM v$flashback_database_log;
TO_CHAR(OLDEST_FLAS
——————-
2019-03-12 13:30:40SQL> exit
Disconnected from Oracle Database 12c Enterprise Edition Release 12.1.0.2.0 – 64bit Production
With the Partitioning option
you have mail in /usr/spool/mail/oracle
TEST RBTEST 12.1.0.2 > rmanRecovery Manager: Release 12.1.0.2.0 – Production on Thu Mar 14 09:23:12 2019
Copyright (c) 1982, 2014, Oracle and/or its affiliates. All rights reserved.
RMAN> connect target
connected to target database: RBTEST (DBID=4176075174, not open)
RMAN> connect catalog rcat/******@catdb
connected to recovery catalog database
RMAN> flashback database to restore point WEDNESDAY13032019;
Starting flashback at 14_MAR_2019_09:23:34
allocated channel: ORA_SBT_TAPE_1
channel ORA_SBT_TAPE_1: SID=302 device type=SBT_TAPE
channel ORA_SBT_TAPE_1: Data Protection for Oracle: version 8.1.0.0
allocated channel: ORA_SBT_TAPE_2
channel ORA_SBT_TAPE_2: SID=331 device type=SBT_TAPE
channel ORA_SBT_TAPE_2: Data Protection for Oracle: version 8.1.0.0
allocated channel: ORA_DISK_1
channel ORA_DISK_1: SID=362 device type=DISK
starting media recovery
RMAN-20001: target database not found in recovery catalog
released channel: oem_sbt_backup
RMAN-00571: ===========================================================
RMAN-00569: =============== ERROR MESSAGE STACK FOLLOWS ===============
RMAN-00571: ===========================================================
RMAN-03002: failure of backup command at 02/11/2019 14:36:05
RMAN-03014: implicit resync of recovery catalog failed
RMAN-06004: ORACLE error from recovery catalog database: RMAN-20001: target database not found in recovery catalog
We were seeing the above error after refreshing the database from the live environment to test.
This is caused by the target database not being registered to the catalog.
To resolve you need to connect to the catalog and register the target database:
RMAN> connect to target;
RMAN> connect catalog;
RMAN> register database;
Oracle – Startup Phases
There are 5 states an Oracle database goes through during the startup process.
-
Shutdown
The database is shutdown and cannot be connected to by anyone but SYS. Startup nomount
During this phase the database reads the initialization parameters from the spfile or pfile. If you get an error at this stage, it’s best to check this file exists, is accessible and contains no errors.
This phase does not allow access to the database and is usually only done for database creation, or recreation of control files.Startup mount
During this phase the database checks the control file, this is a small binary file that records the physical structure of the database.
If you receive errors during the mount phase, then it is best to check the control file exists.
This phase allows for certain DBA activities to take place, but does not allow general access to the database.Startup open
During this phase the database tries to start in open mode, ready for all users to access. It checks the datafiles exist and any errors at this stage you should check the datafiles.
This phase can be run in restricted or unrestricted mode, depending on whether you want all users to have access or not.
Oracle – Optimizer stats not being purged
I’ve recently been monitoring two databases where a high amount of import/exports are taking place. The SYSAUX and SYSTEM tablespaces have been continually growing.
To resolve this I set the stats retention period to 7 days.
SQL> exec dbms_stats.alter_stats_history_retention(7);
I then continued to monitor the database and found that the SYSAUX tablespace was still continuing to grow. When checking the retention period it showed it to be as set, so I reduced it further to 3 days.
SQL>    select dbms_stats.get_stats_history_retention from dual;

GET_STATS_HISTORY_RETENTION

---------------------------

3
I then tried rebuilding the stats indexes and tables as they would now be fragmented.
SELECT

sum(bytes/1024/1024) Mb,

segment_name,

segment_type

FROM

dba_segments

WHERE

tablespace_name = 'SYSAUX'

AND

segment_type in ('INDEX','TABLE')

GROUP BY

segment_name,

segment_type

ORDER BY Mb;

MB  SEGMENT_NAME                             SEGMENT_TYPE

--  ---------------------------------------  ----------------

2   WRH$_SQLTEXT                             TABLE

2   WRH$_ENQUEUE_STAT_PK                     INDEX

2   WRI$_ADV_PARAMETERS                      TABLE

2   WRH$_SEG_STAT_OBJ_PK                     INDEX

3   WRI$_ADV_PARAMETERS_PK                   INDEX

3   WRH$_SQL_PLAN_PK                         INDEX

3   WRH$_SEG_STAT_OBJ                        TABLE

3   WRH$_ENQUEUE_STAT                        TABLE

3   WRH$_SYSMETRIC_SUMMARY_INDEX             INDEX

4   WRH$_SQL_BIND_METADATA_PK                INDEX

4   WRH$_SQL_BIND_METADATA                   TABLE

6   WRH$_SYSMETRIC_SUMMARY                   TABLE

7   WRH$_SQL_PLAN                            TABLE

8   WRI$_OPTSTAT_TAB_HISTORY                 TABLE

8   I_WRI$_OPTSTAT_TAB_ST                    INDEX

9   I_WRI$_OPTSTAT_H_ST                      INDEX

9   I_WRI$_OPTSTAT_TAB_OBJ#_ST               INDEX

12  I_WRI$_OPTSTAT_H_OBJ#_ICOL#_ST           INDEX

12  I_WRI$_OPTSTAT_IND_ST                    INDEX

12  WRI$_OPTSTAT_HISTGRM_HISTORY             TABLE

14  I_WRI$_OPTSTAT_IND_OBJ#_ST               INDEX

20  WRI$_OPTSTAT_IND_HISTORY                 TABLE

306 I_WRI$_OPTSTAT_HH_ST                     INDEX

366 WRI$_OPTSTAT_HISTHEAD_HISTORY            TABLE

408 I_WRI$_OPTSTAT_HH_OBJ_ICOL_ST            INDEX
To reduce these tables and indexes you can issue the following:
SQL> alter table <table name> move tablespace SYSAUX;

SQL> alter index <index name> rebuild online;
If you are only running standard edition then you can only rebuild indexes offline. Online index rebuild is a feature of Enterprise Edition.
To find out the oldest available stats you can issue the following:
SQL> select dbms_stats.get_stats_history_availability from dual;

GET_STATS_HISTORY_AVAILABILITY

---------------------------------------------------------------------------

28-JUN-11 00.00.00.000000000 +01:00
To find out a list of how many stats are gathered for each day between the retention the current date and the oldest stats history issue the following:
SQL> select trunc(SAVTIME),count(1) from WRI$_OPTSTAT_HISTHEAD_HISTORY group by  trunc(SAVTIME) order by 1;

TRUNC(SAV COUNT(1)

--------- ----------

28-JUN-11 2920140

29-JUN-11 843683

30-JUN-11 519834

01-JUL-11 958836

02-JUL-11 3158052

03-JUL-11 287

04-JUL-11 1253952

05-JUL-11 732361

06-JUL-11 507186

07-JUL-11 189416

08-JUL-11 2619

09-JUL-11 1491

10-JUL-11 287

11-JUL-11 126324

12-JUL-11 139556

13-JUL-11 181068

14-JUL-11 4832

15-JUL-11 258027

16-JUL-11 1152

17-JUL-11 287

18-JUL-11 27839

21 rows selected.
What has happened here is that the job run by MMON every 24hrs has checked the retention period and tried to run a purge of all stats older than the retention period. As the job has not compeleted within 5 minutes because of the high number of stats collected on each day, the job has given up and rolled back. Therefore the stats are not being purged.
As each day continues the SYSAUX table is continuing to fill up because the job fails each night and cannot purge old stats.
To resolve this we have to issue a manual purge to clear down the old statistics. This can be UNDO tablespace extensive so it’s best to keep an eye on the amount of UNDO being generated. I suggest starting with the oldest and working fowards.
To manually purge the stats issue the following:
SQL> exec dbms_stats.purge_stats(to_date('10-JUL-11','DD-MON-YY'));PL/SQL procedure successfully completed.
SQL> select trunc(SAVTIME),count(1) from WRI$_OPTSTAT_HISTHEAD_HISTORY group by  trunc(SAVTIME) order by 1;

TRUNC(SAVTIME)         COUNT(1)

-------------------- ----------

29-Jun-2011 00:00:00     843683

30-Jun-2011 00:00:00     519834

01-Jul-2011 00:00:00     958836

02-Jul-2011 00:00:00    3158052

03-Jul-2011 00:00:00        287

04-Jul-2011 00:00:00    1253952

05-Jul-2011 00:00:00     732361

06-Jul-2011 00:00:00     507186

07-Jul-2011 00:00:00     189416

08-Jul-2011 00:00:00       2619

09-Jul-2011 00:00:00       1491

10-Jul-2011 00:00:00        287

11-Jul-2011 00:00:00     126324

12-Jul-2011 00:00:00     139556

13-Jul-2011 00:00:00     181068

14-Jul-2011 00:00:00       4832

15-Jul-2011 00:00:00     258027

16-Jul-2011 00:00:00       1152

17-Jul-2011 00:00:00        287

18-Jul-2011 00:00:00      27839

20 rows selected.
Once the amount of stats has been reduced the overnight job should work, alternatively you can create a job to run this similarly to running manually. Using the following code in a scheduled job:
BEGIN

sys.dbms_scheduler.create_job(

job_name => '"SYS"."PURGE_OPTIMIZER_STATS"',

job_type => 'PLSQL_BLOCK',

job_action => 'begin

dbms_stats.purge_stats(sysdate-3);

end;',

repeat_interval => 'FREQ=DAILY;BYHOUR=6;BYMINUTE=0;BYSECOND=0',

start_date => systimestamp at time zone 'Europe/Paris',

job_class => '"DEFAULT_JOB_CLASS"',

comments => 'job to purge old optimizer stats',

auto_drop => FALSE,

enabled => TRUE);

END;
Finally you will need to rebuild the indexes and move the tables. To do this you can spool a script to a dmp file and then run the dmp file.
SQL> select 'alter index '||segment_name||' rebuild;' FROM dba_segments where tablespace_name = 'SYSAUX' AND segment_type = 'INDEX';
Edit the file to remove the first and last lines (SQL> SELECT…. and SQL> spool off)
Run the file to rebuild the indexes.
You can then do the same with the tables
SQL> select 'alter table '||segment_name||' move tablespace SYSAUX;' FROM dba_segments where tablespace_name = 'SYSAUX' AND segment_type = 'TABLE';
Then you can re-run the original query, mine produces the following now and my SYSAUX table is only a few hundred MB full.
.6875 WRH$_ENQUEUE_STAT                 TABLE

.75 WRH$_SEG_STAT_OBJ                   TABLE

.8125 WRH$_SYSMETRIC_SUMMARY_INDEX      INDEX

.8125 I_WRI$_OPTSTAT_HH_ST              INDEX

.8125 WRH$_SQL_PLAN_PK                  INDEX

1 WRI$_OPTSTAT_HISTHEAD_HISTORY         TABLE

1 SYS$SERVICE_METRICS_TAB               TABLE

2 I_WRI$_OPTSTAT_HH_OBJ_ICOL_ST         INDEX

2 WRH$_SYSMETRIC_SUMMARY                TABLE

2 WRI$_ADV_PARAMETERS                   TABLE

2 WRI$_ADV_PARAMETERS_PK                INDEX

4 WRH$_SQL_PLAN                         TABLE

689 rows selected.
Oracle – Fix unusable indexes
If you want to find a list of unusable indexes and fix them you can issue the following SQL that will print out a list of alter commands that can be copied and pasted to the SQL command line then executed to fix the indexes.
SQL> select 'alter index '||index_name||' rebuild;' from all_indexes  where status ='UNUSABLE';

'ALTERINDEX'||INDEX_NAME||'REBUILD;'

--------------------------------------------------

alter index I_WRI$_OPTSTAT_HH_ST rebuild;

alter index I_WRI$_OPTSTAT_H_OBJ#_ICOL#_ST rebuild;

alter index I_WRI$_OPTSTAT_H_ST rebuild;

alter index I_WRI$_OPTSTAT_OPR_STIME rebuild;
This will help resolve errors such as the following:
SQL>  exec dbms_stats.purge_stats(to_date('28-JUN-11','DD-MON-YY'));

BEGIN dbms_stats.purge_stats(to_date('28-JUN-11','DD-MON-YY')); END;

*

ERROR at line 1:

ORA-01502: index 'SYS.I_WRI$_OPTSTAT_TAB_OBJ#_ST' or partition of such index is in unusable state

ORA-06512: at "SYS.DBMS_STATS", line 1100

ORA-06512: at "SYS.DBMS_STATS", line 17203

ORA-06512: at line 1
Oracle – ORA-01502 Index rebuild error
I was recently trying to clear down the SYSAUX tablespace that had filled with fragmented statistics retention indexes and tables.
However, when I tried to rebuild one of the indexes I received the following error:
SQL> alter index I_WRI$_OPTSTAT_H_ST rebuild;

alter index I_WRI$_OPTSTAT_H_ST rebuild

*

ERROR at line 1:

ORA-00604: error occurred at recursive SQL level 1

ORA-01502: index 'SYS.I_WRI$_OPTSTAT_IND_OBJ#_ST' or partition of such index is in unusable state
I queried the sys.all_indexes table to find which indexes were in an unusable state.
SQL> select index_name, status from all_indexes where status ='UNUSABLE';

INDEX_NAME                     STATUS

------------------------------ --------

I_WRI$_OPTSTAT_IND_OBJ#_ST     UNUSABLE

I_WRI$_OPTSTAT_IND_ST          UNUSABLE

I_WRI$_OPTSTAT_H_OBJ#_ICOL#_ST UNUSABLE

I_WRI$_OPTSTAT_H_ST            UNUSABLE
To resolve the issue I rebuild the offending index and all was well and good again.
SQL> alter index I_WRI$_OPTSTAT_IND_OBJ#_ST rebuild online;

Index altered.
Oracle – Logical Standby Dataguard Error
The following error is thrown up when any user other than sys tries to log onto the database. The third and fourth lines of the error are a red herring which made me investigate the package. After comparing the package in the reporting (logical standby) database and finding it to be exactly the same as that in the production database, I investigated the database guard error.
SQL> conn /

ERROR:

ORA-00604: error occurred at recursive SQL level 1

ORA-16224: Database Guard is enabled

ORA-06512: at "OASIS.OASLOGONCHECK_PACKAGE", line 377

ORA-06512: at line 8

Warning: You are no longer connected to ORACLE.
There are three options for dataguard status – all, standby, or none. I queried v$database to see which option was set for my logical standby:
SQL> select guard_status from v$database;

GUARD_S

-------

ALL
Guard_status protects the data from being changed.
ALL– All users other thanSYSare prevented from making changes to any data in the database.STANDBY– All users other thanSYSare prevented from making changes to any database object being maintained by logical standby.NONE– Indicates normal security for all data in the database.
Therefore the users could not log onto the database because the trigger being called on logon was unable to make updates to the database. I updated the guard_status to “standby” and the issue resolved.
SQL> alter database guard standby;

Database altered.

SQL> conn /

Connected.
Supporting British Business

Katherine makes beautiful handmade greetings cards. Please support British Business by purchasing a unique card from her.
